
You can write the best content on the internet. Doesn’t matter. If your page takes five seconds to load, most visitors are gone before they read a single word.
That’s not an opinion. It’s what Google measures, scores, and now uses as a ranking input. Core Web Vitals are the specific numbers behind that judgment — and most sites fail at least one of them without knowing it.
This guide breaks down all three metrics, shows you exactly how to measure them, and gives you a step-by-step fix list you can start on today.
Key Takeaways
- Core Web Vitals are three metrics — LCP, INP, and CLS — that measure loading speed, interactivity, and visual stability.
- FID is dead. Google fully replaced it with INP in March 2024. If your checklist still mentions FID, it’s outdated.
- A “good” Core Web Vitals score means: LCP under 2.5s, INP under 200ms, and CLS under 0.1 — measured at the 75th percentile of real visitors.
- Core Web Vitals are part of Google’s Page Experience signal, and slow pages correlate directly with higher bounce rate and lower conversions.
- Most CWV failures trace back to three culprits: unoptimized hero images, render-blocking scripts, and content that loads without reserved space.
What Are Core Web Vitals & Why Do They Matter for SEO?
Core Web Vitals are a set of three metrics Google uses to measure real-world user experience on a page: how fast it loads, how quickly it responds to interaction, and how visually stable it is while loading.
They’re part of a broader ranking factor Google calls the Page Experience signal, which also includes mobile-friendliness, HTTPS, and the absence of intrusive interstitials. Core Web Vitals sit at the center of that signal because they’re the part Google can measure objectively, at scale, from actual Chrome users.
Here’s why that matters beyond rankings.
As page load time increases from one second to five seconds, the probability of a visitor bouncing rises sharply. A slow page doesn’t just rank worse. It converts worse, because the people who do land on it leave before they act.
That’s the real link between page speed and SEO: speed isn’t a separate technical checkbox. It’s the first filter your content has to pass before anyone reads the thing you spent hours writing.
If you’re auditing a site’s technical foundation, Core Web Vitals is one piece of it — structured data, crawlability, and indexation issues sit right alongside it. If you want a clear breakdown of the structured data side, I covered it in my complete guide to schema markup.
The Big Three Metrics Explained Simply
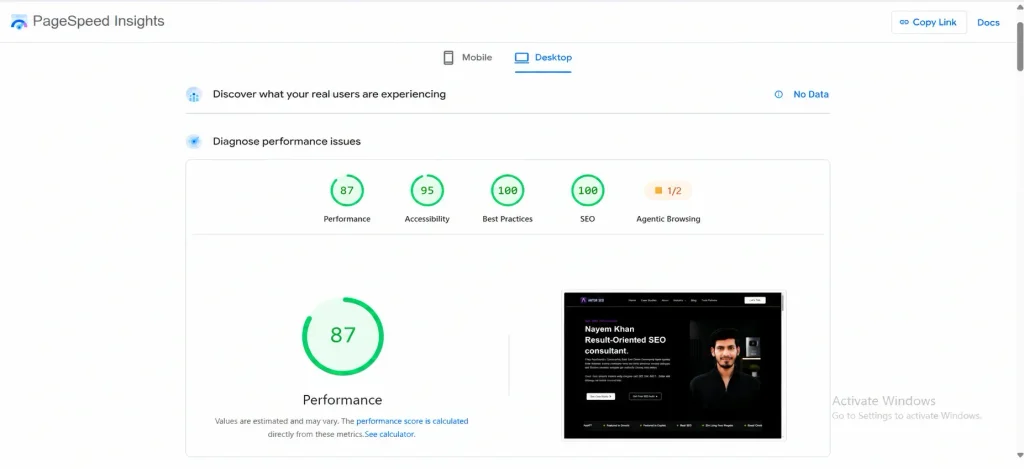
Let’s go through each metric — what it measures, the exact thresholds, and what usually breaks it.
1. LCP (Largest Contentful Paint)
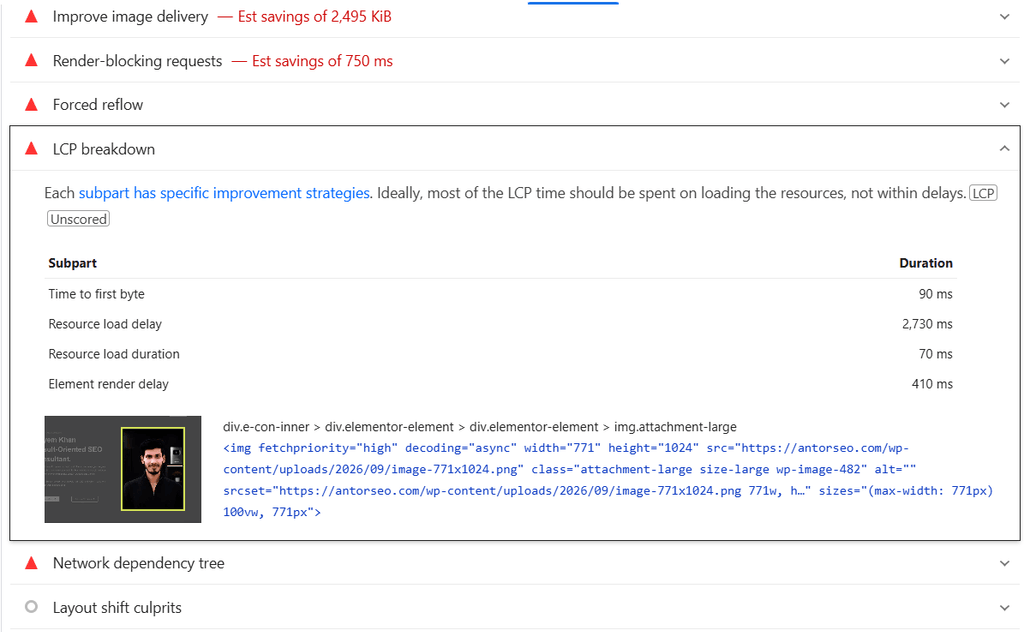
LCP measures how long it takes for the largest visible element on the screen to fully render. That’s usually a hero image, a background image, or a large block of text. Google’s own definition of Largest Contentful Paint explains it in more technical depth if you want the full spec.
It answers one question for the visitor: “Is this page actually loading?”
Thresholds:
| Rating | LCP Time |
|---|---|
| Good | 2.5 seconds or less |
| Needs Improvement | 2.5 – 4.0 seconds |
| Poor | Over 4.0 seconds |
Main culprits:
- Slow server response time (high Time to First Byte)
- Render-blocking JavaScript and CSS that delay the browser from painting anything
- Unoptimized hero images — full-resolution PNGs served with no compression
- Client-side rendering that makes the browser build the page before showing it
- Slow third-party fonts or resources loaded before the main content
2. INP (Interaction to Next Paint)
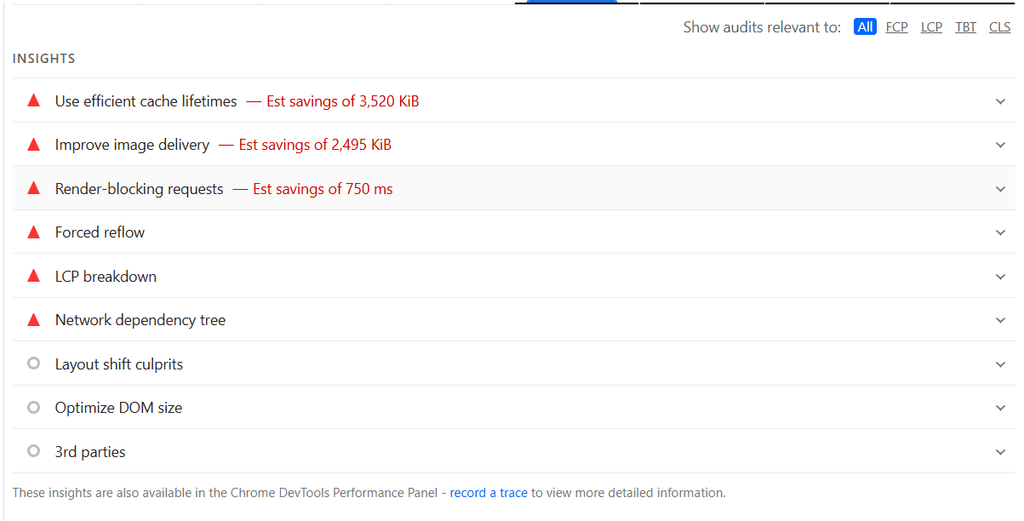
INP measures how quickly your page responds when someone clicks, taps, or types — and it looks at every interaction on the page, not just the first one.
This is the metric people get wrong most often. FID (First Input Delay) used to measure only the delay before the first interaction started processing. FID was retired in March 2024 and permanently replaced by INP. Google’s official INP documentation is worth bookmarking if a checklist you’re reading still mentions FID — it hasn’t been updated in over a year.
Thresholds:
| Rating | INP Time |
|---|---|
| Good | 200 milliseconds or less |
| Needs Improvement | 200 – 500 milliseconds |
| Poor | Over 500 milliseconds |
Main culprits:
- Long JavaScript tasks blocking the browser’s main thread
- Heavy event handlers (menus, filters, modals) that recalculate too much on every click
- Bloated DOM size, which slows down style recalculation and layout
- Third-party scripts (chat widgets, ad tags, analytics) competing for the main thread
3. CLS (Cumulative Layout Shift)
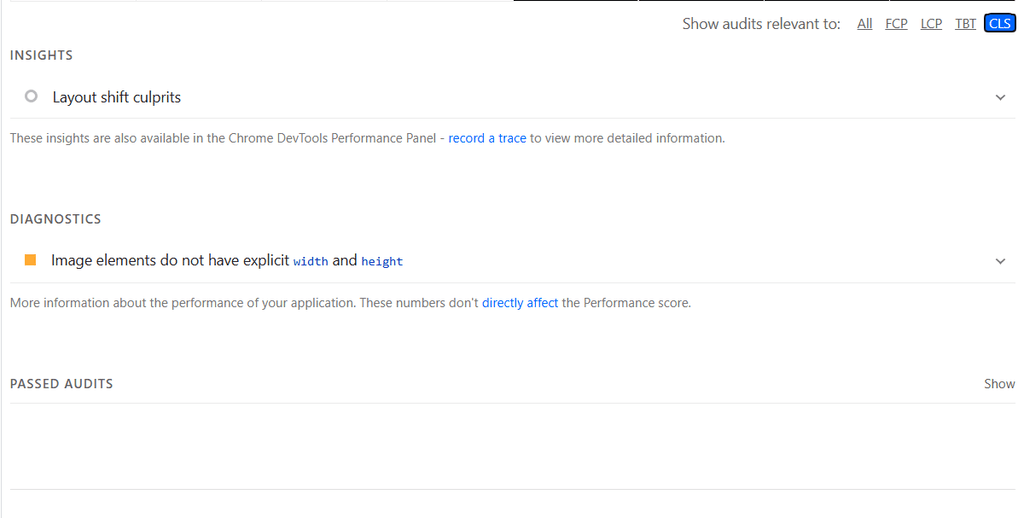
CLS measures visual stability — how much content unexpectedly moves around while the page is loading. The official CLS breakdown shows exactly how the score is calculated if you want the underlying math.
You’ve felt this: you go to tap a button, and an ad loads above it at the last second, so you tap the wrong thing. That jump is exactly what CLS scores.
Thresholds:
| Rating | CLS Score |
|---|---|
| Good | 0.1 or less |
| Needs Improvement | 0.1 – 0.25 |
| Poor | Over 0.25 |
Main culprits:
- Images and video embeds with no width and height attributes set
- Dynamically injected ads or embeds that push content down after it’s already loaded
- Web fonts that swap in and change text size or spacing (FOIT/FOUT)
- Content inserted above existing content via JavaScript, after the initial render
How to Measure Your Core Web Vitals
You can’t fix what you haven’t measured. Here are the tools that actually matter:
- Google PageSpeed Insights – Gives you both lab data (a simulated test) and field data (real visitor data) for any URL. Run your homepage through pagespeed.web.dev right now — takes 30 seconds.
- Google Search Console → Core Web Vitals report – Shows you which URLs on your entire site are failing, grouped by issue type, using real user data over the last 28 days. This is the report Google actually uses to judge your site.
- Chrome UX Report (CrUX) – The raw dataset behind Search Console and PageSpeed Insights, pulled from real Chrome users who’ve opted into usage reporting. Chrome for Developers documents how to query it directly if you manage a large site.
- Web Vitals Chrome Extension – Shows live LCP, INP, and CLS scores in your browser as you navigate the page yourself, in real time.
One distinction that trips people up: lab data (Lighthouse, PageSpeed’s simulated test) and field data (real Chrome users) can disagree. Google ranks based on field data. Always trust the Search Console Core Web Vitals report over a single Lighthouse run.
The Ultimate Core Web Vitals Checklist
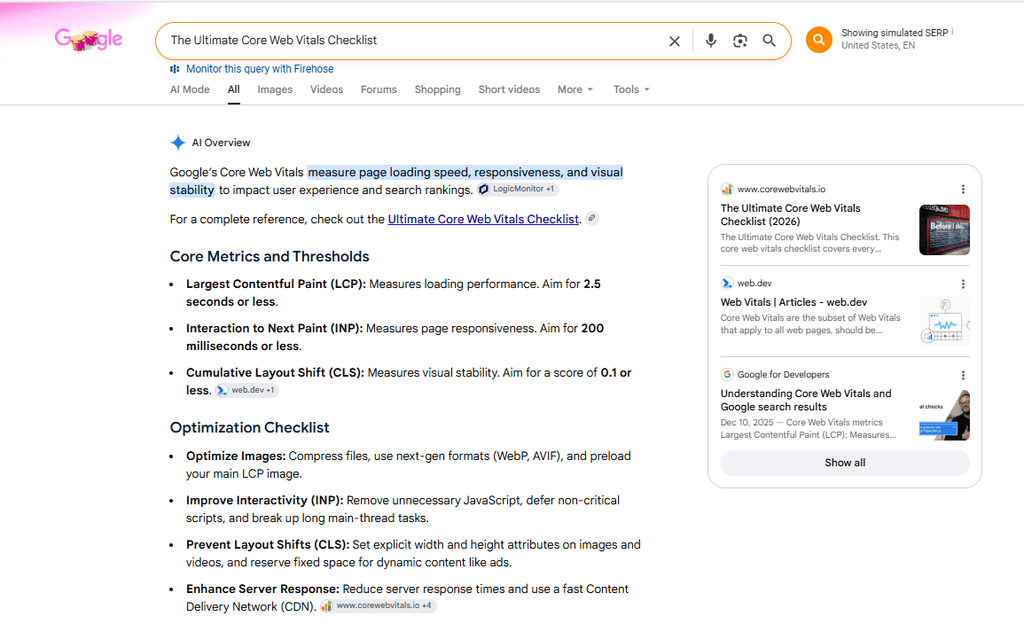
Print this. Work through it in order.
LCP Quick Wins
- Compress and convert your hero image to WebP or AVIF
- Preload your LCP image with
- Move to a faster host or add a CDN to cut server response time
- Eliminate render-blocking CSS and JS above the fold
- Enable server-side or edge caching
INP Quick Wins
- Break up long JavaScript tasks (over 50ms) into smaller chunks
- Remove or defer unnecessary third-party scripts
- Debounce heavy event handlers (search filters, live validation)
- Reduce your total DOM size on template-heavy pages
- Use code splitting so pages only load the JS they actually need
CLS Quick Wins
- Add explicit width and height (or aspect-ratio) to every image and video
- Reserve fixed space for ad slots and embeds before they load
- Use font-display: swap and preload critical fonts
- Avoid inserting new content above existing content after load
- Test every template type (homepage, blog post, product page) separately
Step-by-Step: How to Improve Core Web Vitals
Here’s the order that gets you the fastest wins first.
Step 1: Put a CDN in front of everything.
A content delivery network serves your assets from a server physically closer to the visitor, which cuts both server response time and LCP. This is usually the single highest-leverage fix for global or high-traffic sites.
Step 2: Turn on caching at every layer.
Browser caching, server-side caching, and object caching all reduce how much work has to happen on every single page load. If you’re on WordPress, this alone can shave a full second off LCP.
Step 3: Compress and modernize your images.
Convert hero images and product photos to WebP or AVIF, and compress everything before upload. A 3MB hero image dragged straight out of a camera roll is still the number one LCP killer we see in audits.
Step 4: Defer or remove non-critical JavaScript.
Anything not needed to render the visible page — chat widgets, non-critical analytics, below-the-fold interactive elements — should load with defer or async, not block the initial render. The web-vitals JavaScript library is the standard way to actually measure the impact of these changes on real users after you ship them.
Step 5: Set font-display: swap on your web fonts.
This stops invisible text (FOIT) while fonts load, and prevents the layout jump that happens when a fallback font gets swapped for the real one.
Step 6: Reserve space for every image, embed, and ad unit.
Set explicit dimensions or use CSS aspect-ratio so the browser allocates space before the content arrives. This single habit eliminates most CLS problems on its own.
Step 7: Lazy-load everything below the fold — never your LCP element.
Lazy loading saves bandwidth on images the visitor hasn’t scrolled to yet. But lazy-loading your actual LCP image delays it, which makes your score worse, not better. Exclude it explicitly.
Real-World Audit Takeaways from Antor SEO
A few patterns show up in almost every technical audit we run, regardless of industry:
- Page builders are the quiet villain. Elementor, Divi, and similar builders generate bloated CSS and extra DOM nodes by default. Sites built on them often need a dedicated cleanup pass just to get LCP under control.
- Third-party chat and review widgets tank INP. They’re small individually, but stacked together (live chat + review popup + heatmap script + ad tag) they eat the main thread and make every click feel sluggish.
- Healthcare and SaaS sites are the worst offenders for CLS, because both rely heavily on embedded forms, booking widgets, and dynamic trust badges that load after the initial paint. We break down what that looks like in practice on our SaaS SEO page.
- Fixing Core Web Vitals rarely requires a redesign. Most of the time it’s compression, caching, and a handful of dimension attributes — the kind of fix visible in the results we’ve documented across past case studies.
Frequently Asked Questions
-
What is a good Core Web Vitals score?
A “good” score means passing all three metrics at the 75th percentile of real visitors: LCP under 2.5 seconds, INP under 200 milliseconds, and CLS under 0.1. Google’s Search Console shows this per-URL using actual field data, not a single test.
-
Do Core Web Vitals affect SEO rankings?
Yes, but as one of many ranking signals, not a dominant one. Core Web Vitals are part of Google’s Page Experience signal. They matter more as a tiebreaker between pages of similar relevance and quality, and they matter a lot for conversion rate regardless of ranking impact.
-
What replaced FID in Core Web Vitals?
INP (Interaction to Next Paint) permanently replaced FID as an official Core Web Vital in March 2024. FID only measured the delay before the first interaction; INP measures responsiveness across every interaction during the entire page visit.
-
How often does Google update Core Web Vitals data?
The Chrome UX Report and Search Console’s Core Web Vitals report use a rolling 28-day window of real user data, so changes you make today typically take a few weeks to fully reflect in your scores.
-
Can I fix Core Web Vitals without a developer?
Some fixes, yes — image compression, enabling a caching plugin, or switching CDN settings can often be done inside your CMS. But JavaScript-heavy INP issues and structural CLS problems in a theme or builder usually need a developer or a technical SEO audit to diagnose correctly. That’s exactly the kind of gap we map out for clients on the Antor SEO homepage.
Conclusion
Core Web Vitals aren’t a vanity metric. They’re the difference between a visitor who reads your page and one who bounces before your headline even renders.
Fix LCP first, because nothing else matters if the page hasn’t painted. Fix CLS next, because it’s usually a five-minute win. Then dig into INP, because it’s the one that requires actual profiling.
Run your site through PageSpeed Insights today. If the numbers make you wince, get a free performance audit from Nayem Khan and we’ll show you exactly what’s slowing you down — and what to fix first.